This past month, The Education Trust, a national nonprofit that works to close opportunity gaps in preschool through college, released a report about the quality of school funding data provided by all 50 states. Illinois was the only state to earn a perfect score for providing clear, comprehensive, and easily accessible data about K-12 school spending. Design and development for the presentation of these data is the work of the Illinois Interactive Report Cards (IIRC) Office at NIU.
The IIRC, which has designed and managed the Illinois Report Card (illinoisreportcard.com) for more than two decades, has a contract with the Illinois State Board of Education (ISBE) to disseminate these data through the website. Data presented by the report card site come from ISBE, the Illinois Community College Board and the Illinois Board of Higher Education, as well as individual schools and districts. The IIRC’s team of computer scientists, data analysts, web designers and database managers play a critical role in telling an honest, clear and compelling story about the current state of education in Illinois – and opportunities for improvement.

Alan Clemens
“Illinois has long been considered a leader in educational data reporting at the K-12 level because the Illinois Report Card was one of the first public data reporting systems of its kind,” says Alan Clemens, director of the NIU Interactive Report Cards Office. “We continue to do everything we can to push the envelope. For example, several years ago, ISBE started making a concerted effort to better highlight equity in its data tracking. The data are part of a larger conversation between the public, the Illinois General Assembly and the state board of education. Starting from accurate data helps us find common ground to achieve what we all desire: a more equitable and effective education system that serves all youth in Illinois.”
One of the elements that sets Illinois’ approach apart is the depth and specificity it allows. Like other states, illinoisreportcard.com provides an overall snapshot of state data, including ninth-grade on-track rate, graduation rate and achievement gaps based on race, gender, income and other factors. But the Illinois Report Card also provides local data that goes beyond that presented by other states. For example, users can search by district or school to zero in on specific data, such as the spending per student, average class size, teacher retention and student achievement in a single school building compared to district and state averages.
“The unique formula takes into account factors that affect the cost of educating a student within that student’s local context,” says Clemens. “If you examine the funding analyses for school districts and even individual schools, you’ll see factors included like the distribution and density of students receiving special education services, the density and distribution of students who are second-language learners and other factors that we know from research impact the real dollar cost of conducting education around the state. So the score reflects the equity and inclusion values that are part of the key mission of the state board of education.”
Clemens – a longtime educator as well as data specialist – compares this approach to school data to the current push within education circles to tailor learning to each unique student.
“In education circles, we talk about each student being unique. We know that outstanding, effective teachers meet students where they are,” Clemens says. “In the same way, with the IIRC, we recognize that schools are unique, are collections of many different students and local circumstances. So we have to do the same thing with schools that we expect teachers to do when working with students: to recognize that they have unique circumstances, needs and challenges, as well as individual accomplishments and successes.”
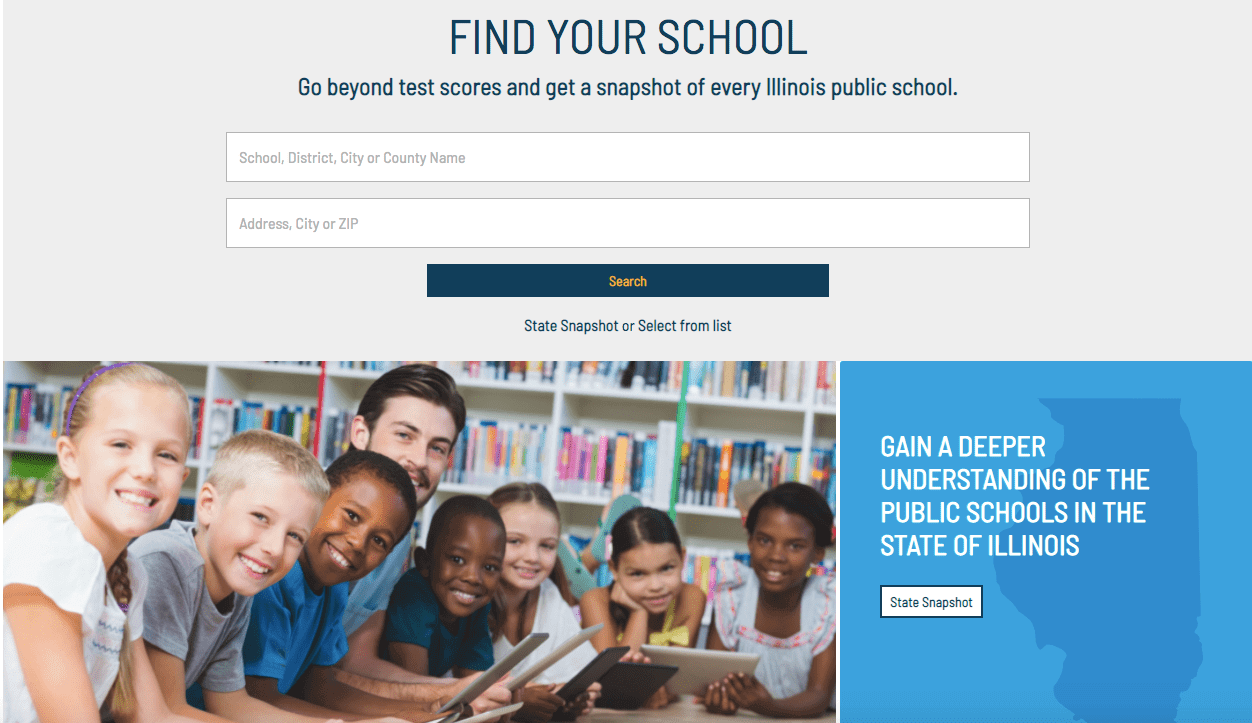
illinoisreportcard.com allows users to search by school, district or location to zoom in on specific school data.
The site-based expenditure data – new data fields laying out the spending of each school in the state – are a recent addition to illinoisreportcard.com. Here and in other locations on the report card site, new fields are being included as part of a broader push to make the site more useful to local superintendents and school boards who want to better understand and tell the story of their district.
“We recognize that this isn’t just the state of Illinois’ story. Behind this data is the story of each school and district across the state,” Clemens says. “Our goal is to provide a space where local practitioners can shape the presentation and reception of the data to really make it their own, so it’s about more than just the numbers. People can talk about plans, movement and progress. It allows a local voice to tell the story and contextualize the data in a way that might be difficult to get from just the numbers alone.”
What does it mean for Illinois to earn a 100% rating for their school funding data? For Clemens and his team, it is a bittersweet moment.
“We’re proud of the work that ISBE and our office have done to transparently, comprehensively report school data in Illinois,” Clemens says. “It’s wonderful to get this recognition for all the effort that has gone into this partnership. At the same time, the actual data for Illinois and the rest of the country point to the continued work that’s necessary to make education spending more equitable. We hope that public attention to this report will motivate and enhance the continued improvement of learning conditions and outcomes for all students in Illinois and across the country.”
The need for continued work and improvement is good news for NIU faculty and student researchers, who may conduct research using the Illinois state educational data.
Clemens and the IIRC team recently partnered with units across NIU – including the Center for P-20 Education, College of Education, Center for Governmental Studies, Education Systems Center and Illinois P-20 Network – to create the P-20 Research and Data Collaborative. The collaborative welcomes research proposals and inquiries from across the university and works to facilitate research projects and partnerships, providing expert support from its team of data analysts.
“Anyone who’s interested in working with these data and engaging in research about education in the state – we’re here to help you and work with you,” says Clemens. “Part of our mission is to facilitate student development and student employment, faculty research and engagement with other projects across campus. We’re already working on projects with faculty from the College of Education and the College of Business, and we’re really looking forward to building more relationships. We’re trying every day to find new opportunities to expand our collaborations and support research with the power to improve education in the state.”
The Illinois Interactive Report Cards Office is part of the NIU Division of Outreach, Engagement and Regional Development. Learn more on the IIRC website, or explore Illinois educational data at illinoisreportcard.com. To learn more about collaborating on your research project, contact Alan Clemens at aclemens@niu.edu.